Dividend Calculators: How to Choose the Right Tool
Dividend calculators answer different questions. Match the tool to the decision you are making, check that its inputs fit your holding, and read every projection as a scenario rather than a promise.
THE SHORT ANSWER
Choose among dividend calculators by the result you need
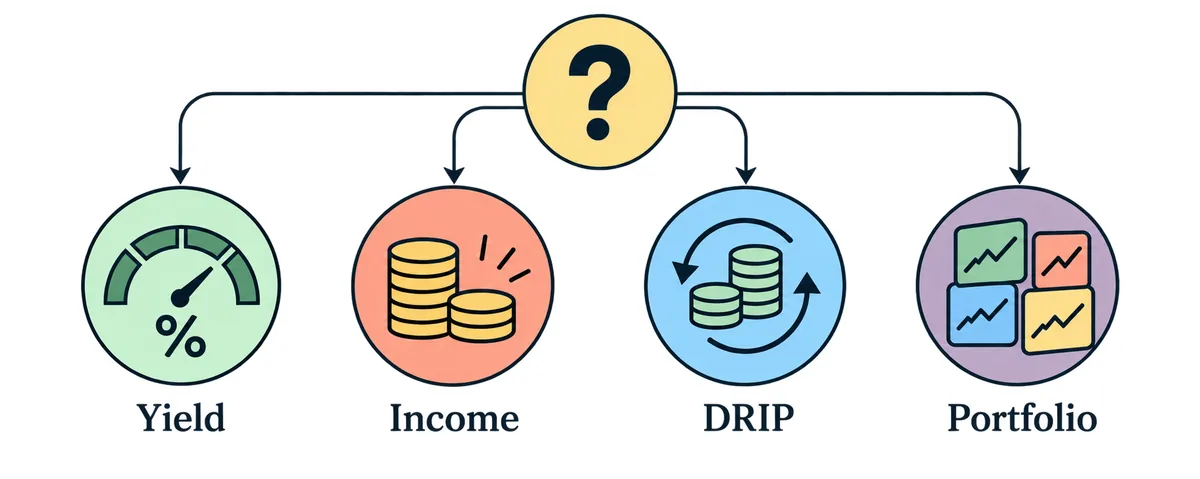
Dividend calculators include yield, income, reinvestment, and portfolio tools. Use a yield calculator to compare a dividend with a share price, an income calculator to estimate cash payments, a DRIP calculator to model reinvestment, and a portfolio calculator to combine holdings and contributions. Before entering values, confirm whether the tool expects a yield or a dividend per share, how it treats payment timing, and which growth and tax assumptions it applies.
One holding: start with its annual dividend per share, share count, and payment schedule.
A future scenario: add a time horizon, contributions, separate dividend and price growth, and a reinvestment choice.
A portfolio: check how the calculator combines different holdings, currencies, and payout schedules.
Start with the question you want answered, then choose a calculator whose inputs and outputs match it.MATCH THE QUESTION
How dividend calculators answer different questions
Dividend calculators can share a label while using different definitions, periods, or assumptions. A useful first check is to state the question in plain language: “What is the current yield?”, “How much cash could this holding distribute over a year?”, or “How might reinvestment change a long-term scenario?”
The comparison below separates common tasks by the facts they need and the result they return. It can help you reject a calculator that produces a precise-looking number without answering your actual question.
Compare the question, inputs, output, and main limitation.
Your question
Calculator type
Useful inputs
Typical output
Main check
Dividend relative to price?
Yield
Annual dividend per share and share price
A percentage
Check period and price date.
What could one holding pay yearly?
Income
Shares and annual dividend, or investment and yield
Annual income or monthly average
Is the amount current, trailing, or assumed?
What if payments buy shares?
DRIP
Starting value, payout, price, frequency, horizon
Shares, income path, or ending value
Check fractional shares and timing.
How could several holdings develop?
Portfolio
Holdings, contributions, payouts, and horizon
Combined income and value
Check weighting, currency, and fees.
How could the payout change?
Dividend growth
Current payout and assumed growth
A future income path
Growth is a scenario, not a forecast.
READ THE LABELS
What each calculation mode measures
The same words can hide different inputs. Read the formula or field descriptions before comparing outputs, especially when one calculator asks for a yield and another asks for cash per share.
Yield compares a dividend with a price
Dividend yield is annual dividend per share divided by share price. An assumed $1.20 annual dividend at a $40 share price gives a 3% yield.
That percentage does not reveal your cash income without a share count. Yield can also change with price even when the declared dividend stays the same, so review a high yield against the underlying payout.
Income turns a payout into a cash estimate
For one holding, annual income is shares multiplied by annual dividend per share. Another tool may multiply investment amount by yield; the methods agree only when price and payout periods align.
“Average monthly” often means annual income divided by twelve. It is a planning average, not a monthly payment schedule.
DRIP models reinvestment choices
A dividend reinvestment plan uses distributions to buy shares. A DRIP calculator models how that choice may affect share count, later income, or ending value.
Check whether it reinvests on payment dates or at a simplified interval, permits fractional shares, and accounts for leftover cash. Missing details make a long-range result a broad illustration.
Portfolio projections combine more moving parts
A portfolio calculator combines holdings that may have different yields, payout dates, currencies, and contributions. Check how it weights positions and handles cash, fees, taxes, and missing data; a total can hide concentration in one holding.
Dividend growth and share-price growth are separate assumptions: a rising payout does not guarantee price appreciation, which is not dividend income.
BEFORE YOU CALCULATE
Inputs and assumptions to verify
Compare dividend calculators only after checking that their inputs use matching periods and units. Find out whether “dividend” means the latest payment, trailing twelve months, or an annual amount. Use this checklist when field definitions are unclear:
Shares or dollars: some tools begin with a share count; others infer shares from an investment amount and assumed price. Do not enter both as though they were independent.
Per-share amount or yield: annualize the payment consistently. A quarterly amount is not an annual amount until its schedule is accounted for.
Regular or special distribution: a one-time payment may not recur. Investor.gov notes that public companies usually pay on a fixed schedule but can issue dividends at any time, including special dividends.
Payment frequency: check whether monthly, quarterly, semiannual, or annual timing changes only the display or also changes the reinvestment calculation.
Growth and contributions: enter dividend growth separately from share-price growth, and confirm whether recurring contributions are added at the start or end of each period.
Taxes, fees, and inflation: look for country, account, tax-year, fee, and inflation limits. A single generic tax percentage cannot represent every investor's situation.
FOLLOW THE UNITS
A simple dividend income example
Suppose you hold 100 shares and assume a regular $0.30 dividend per share each quarter. One payment is 100 × $0.30, or $30; four equal payments total $120 for the year before taxes, fees, or changes.
An annual per-share field would use $1.20. At an assumed $40 price, that equals a 3% yield. Entering the quarterly $0.30 into a field expecting an annual amount understates income by four times.
The $120 annual total averages $10 per month, but the example still pays quarterly. A one-time special distribution should not automatically be projected as recurring.
COMPARE THE METHOD
Why dividend calculator estimates can differ
Identical-looking inputs can produce different results when calculators use different periods, timing rules, or growth methods. Compare these conventions before deciding that one result is wrong. If settings are not explained, treat the output as a rough scenario and do not infer precision from extra decimals.
Input basis: one tool may use a yield and price while another uses a stated dividend per share or a trailing cash total.
Timing: payments or deposits may be placed at the start or end of a month, quarter, or year. Compounding at each payment date can differ from a yearly approximation.
Reinvestment: models can vary in fractional-share support, purchase price, reinvestment dates, and handling of residual cash.
Extra assumptions: tax, fees, inflation, contribution increases, and dividend or price growth may be included by one page and omitted by another.
A FOUR-STEP REVIEW
A short checklist for choosing a tool
When choosing between dividend calculators, start with one that explains its fields. A short review can prevent a unit mismatch from becoming a misleading income target.
Write down the result you want.
Choose a current yield, one holding's annual income, a DRIP comparison, or a combined portfolio scenario.
Gather the matching inputs.
Use the same share count, price date, payout period, and currency throughout. Mark any value you are estimating rather than verifying.
Read the assumptions.
Confirm payment timing, reinvestment behavior, growth, taxes, fees, and whether results are nominal or inflation-adjusted.
Compare more than one scenario.
Keep a baseline, then change one assumption at a time. A lower payout, no growth, or a price decline can show how sensitive the result is.
Ready to model an editable scenario?
The Dividend Calculator lets you enter an investment, yield, monthly contribution, and horizon, then inspect optional growth and DRIP assumptions.
A calculator applies a model to supplied inputs. It cannot know whether a company will maintain its dividend, whether a fund's future distribution will match its past payout, or whether a share price will follow an assumed growth rate. Payments may change, while market prices can move independently.
Taxes vary by jurisdiction, account, income, tax year, withholding, and payment type. Fees, trading costs, currency conversion, and timing also affect results. Verify inputs with issuer information and relevant tax guidance; seek qualified advice for personal decisions.
Use a projection to inspect assumptions and compare scenarios, not as a recommendation or guarantee. Sensitivity to a changed input is part of the result.
A PRIMARY REFERENCE
Dividend timing and special payments
Investor.gov defines a dividend as a portion of a company's profit paid to shareholders and notes that a company may issue a dividend outside its usual fixed schedule. This is why a calculator's frequency setting should be checked against the actual payment and why a special distribution should not automatically be projected as recurring income.
Start with the result you need. Use a yield calculator for dividend relative to price, an income calculator for an estimated cash amount, a DRIP calculator for reinvestment scenarios, and a portfolio calculator for several holdings or contributions.
Is dividend yield the same as dividend income?
No. Yield is a percentage that compares an annualized dividend per share with share price. Income is a cash amount that also depends on the number of shares or the investment amount and yield.
Why does a calculator show average monthly income?
Many tools divide estimated annual income by twelve to give a planning average. It does not mean the company or fund pays monthly; check the actual distribution schedule separately.
Can a DRIP calculator predict future returns?
No. It can illustrate how reinvestment interacts with entered payout, price, growth, timing, and tax assumptions. Dividends and market prices can change, so the output is a scenario rather than a forecast.