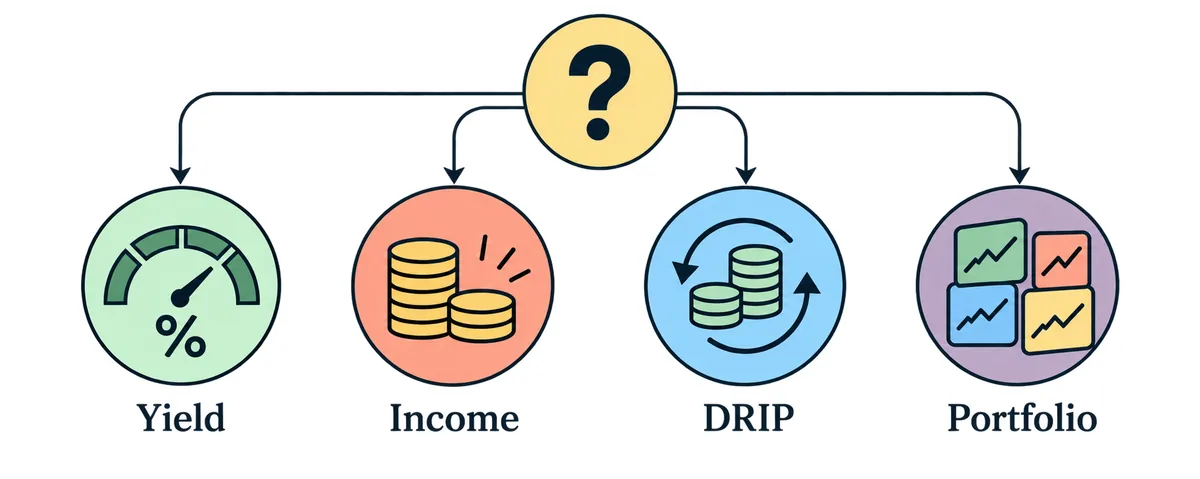
Dividend Income Calculators: A Dividend Income Calculator Guide
A dividend income calculator helps turn a yield, portfolio value, contribution plan, and time horizon into a clear income scenario. Use this guide to separate annual income from average monthly income, estimate the portfolio needed for a goal, and understand how reinvestment and growth assumptions change the result.
THE SHORT ANSWER
Use income math to plan a target, not to promise a payout
A dividend income calculator usually starts with either an investment amount and yield or a monthly income goal and yield. The first path estimates gross annual income and a planning average per month. The second reverses the same relationship to estimate the portfolio value that could support a goal under the chosen yield. A useful page also shows contributions, taxes as an editable assumption, reinvestment, and the difference between a modeled average and an actual payment schedule.
Start with the income question you need to answer, then choose assumptions that match your holding and time horizon.START WITH THE OUTPUT
Dividend income is a cash amount; yield is a rate
Dividend yield and dividend income are connected, but they answer different questions. Yield is a percentage that compares an annualized dividend per share with a share price. Income is the cash amount created by the number of shares or the investment amount. A calculator can show both, but it should not let a percentage stand in for dollars when you are planning a budget.
A simple income page should also label its time period. Annual income is the total modeled amount over twelve months. Average monthly income is annual income divided by twelve; it is a planning average, not proof that a company or fund pays every month. Actual payments may be monthly, quarterly, semiannual, or irregular, so keep the payment schedule visible when it matters.
Match the dividend question to the right output.
Question
Core inputs
Useful output
Check before trusting it
How much could this investment pay?
Investment amount and assumed yield
Gross annual income and monthly average
Is the yield current, trailing, or user-entered?
What portfolio could support $1,000 a month?
Monthly goal and annual yield
Starting portfolio estimate
Does the calculation ignore taxes, fees, or yield changes?
How long could contributions take?
Starting value, contribution, years, growth
Year-by-year income and value
Are price growth and dividend growth separate assumptions?
What if dividends are reinvested?
Payout, price, frequency, DRIP choice
Shares and ending value with or without DRIP
Are fractional shares and reinvestment timing modeled?
What might I receive after tax?
Gross income and an entered tax rate
Illustrative after-tax amount
Is the rate a simplified scenario rather than tax advice?
MAKE THE MATH AUDITABLE
Inputs and formulas behind a dividend income calculator
The fastest estimate is intentionally simple: annual dividend income equals invested amount multiplied by annual dividend yield. If the invested amount is $25,000 and the assumed yield is 4%, the gross annual estimate is $1,000 and the average monthly planning figure is about $83.33. That result does not describe the payment dates and does not predict that the yield will remain 4%.
A target-income calculation reverses the relationship. For a $1,000 monthly goal, annualize the goal to $12,000 and divide by the assumed yield. At 4%, the starting estimate is $300,000; at 3%, it is $400,000; at 5%, it is $240,000. The difference is why a target-income page should show a range instead of a single magic portfolio number.
PLAN A TARGET
How much do you need for monthly dividend income?
The reverse calculation is often the most useful reason to open a dividend income calculator. Start with the amount you want to fund, convert it to an annual goal, and test several yields. The result is a planning range, not a recommendation to chase the highest yield. A high yield can reflect a falling price, an unsustainable payout, or a sector risk that belongs in a separate investment review.
For example, a $500 monthly goal is $6,000 per year. At 3%, the simple portfolio estimate is $200,000. At 4%, it is $150,000. At 5%, it is $120,000. These figures assume the yield applies to the whole portfolio, ignore taxes and fees, and assume the distribution is not reduced. A long-term plan should test a lower-yield case and leave room for cash needs.
Illustrative portfolio needed for a monthly income goal before tax and fees.
Monthly goal
Annual goal
At 3% yield
At 4% yield
At 5% yield
$500
$6,000
$200,000
$150,000
$120,000
$1,000
$12,000
$400,000
$300,000
$240,000
$2,000
$24,000
$800,000
$600,000
$480,000
SEE THE PATH
Worked example: $25,000 plus $500 each month
Suppose an investor starts with $25,000, adds $500 per month, enters a 4% starting yield, assumes 5% annual dividend growth and 3% annual price growth, and turns DRIP on. The point of this example is to show how inputs interact. It is not a forecast for a stock, ETF, or portfolio, and the figures should be replaced with the user's own assumptions.
With DRIP on, the modeled dividend buys fractional shares. That can increase the share count and future income, but it also means the result depends on the assumed price, payment timing, and whether the full dividend is reinvested. With DRIP off, the same dividend can remain as cash; the portfolio value and share count will follow a different path even when the initial yield is identical.
Illustrative scenario only; values are rounded for explanation.
Year
Total contributions
Modeled annual income
Modeled portfolio value
1
$31,000
$1,198
$33,060
5
$55,000
$2,926
$72,061
10
$85,000
$6,428
$141,913
Want to change the assumptions?
Use the browser-based dividend calculator to compare contributions, yield, growth, taxes, and DRIP in one editable scenario.
DRIP and dividend growth change the shape of income
Dividend reinvestment, often called DRIP, changes what happens after a payout. Instead of receiving the modeled cash, the account uses it to buy more shares. More shares can produce more future dividends if the payout continues, but the extra shares are bought at an assumed price and may lose value. A DRIP comparison is therefore a way to inspect compounding mechanics, not a promise of outperformance.
Dividend growth is another separate lever. A 5% growth assumption means the model increases the dividend per share by 5% in each modeled period; it does not mean the company will raise its dividend by that amount. A negative growth input can help stress-test a plan. The strongest article and calculator interfaces let you run a flat, lower, and higher case without hiding the change in a single blended return number.
USE IT WELL
A five-step dividend income planning checklist
A good dividend income calculator is easy to use but still explicit about what it assumes. Before comparing two outputs, put both tools on the same currency, period, yield definition, and tax basis. Then record the scenario so you can revisit it when the holding or your contribution plan changes.
1. Define the question
Choose current income, a monthly target, a future date, or a DRIP comparison. Do not mix a present cash question with a long-term return question.
2. Gather the inputs
Use the amount invested, shares, dividend per share or yield, contribution schedule, and payment frequency that match the holding. Mark any value that is an assumption.
3. Run a base case
Start with no growth or a conservative growth case, then record annual income, average monthly income, contributions, and ending value.
4. Test a range
Change yield, growth, tax, inflation, and DRIP one at a time. Compare the lower case with the base case before looking at an optimistic case.
5. Save the date and limits
Keep the inputs, source date, and notes about taxes, fees, currency, and payment timing. Recheck the scenario when the underlying payout changes.
Run your own base case
The homepage calculator starts with an editable example and shows annual, monthly-average, contribution, and DRIP comparison outputs.
A calculator is a model of entered assumptions. It cannot know whether a company will cut its dividend, whether a fund will change its distribution, what price you will receive, or how a broker will handle withholding and reinvestment. Even a current yield can move when the share price changes, so a precise-looking output should not be treated as a fixed paycheck.
Taxes are especially dependent on location, account type, filing status, income, and tax year. A simple percentage can illustrate a range, but it is not a tax return and should not replace official guidance or professional advice. Fees, currency conversion, minimum lots, and cash drag can also make real results different from a frictionless model.
FURTHER READING
Use official education alongside a scenario
For a separate explanation of compound-growth inputs, compare the assumptions in your scenario with the U.S. Securities and Exchange Commission's investor education calculator. The external reference is educational; it does not validate a dividend yield or predict a payout.
It estimates dividend cash income from an investment amount, shares, dividend per share, or an assumed yield. More advanced versions can model contributions, reinvestment, growth, taxes, inflation, and a future income goal.
How do I calculate monthly dividend income?
For a planning average, multiply the portfolio value by the annual yield and divide the annual result by twelve. Check the real payment frequency separately because a monthly average does not mean the holding pays every month.
How much do I need to invest to earn $1,000 a month?
A simple estimate annualizes the goal to $12,000 and divides by the assumed yield. At 4%, that is $300,000 before taxes and fees; different yields produce different scenarios and are not recommendations.
Does a dividend income calculator include DRIP?
Some do. When DRIP is enabled, the model uses dividends to buy additional fractional shares. Review the assumed price, reinvestment timing, and whether the comparison also shows a cash-dividend case.